Financial/Performance Highlights
Overview of Results for FY2025
During FY2025, the global economy was affected by a lingering sense of uncertainty over the future due to U.S. tariff policies. Against this backdrop, major countries sought to support their economies through monetary easing and other financial policies. In the United States, demand was robust in cutting-edge semiconductor fields, including those related to AI and data centers. On the other hand, demand in China and Europe lacked momentum due to continued stagnation in manufacturing and other sectors. From March 2026 onward, growing tensions in the Middle East led to surges in energy prices and shortages in raw material supplies. Reflecting these and other factors, economies around the world remained quite uncertain.
The Mitsubishi Gas Chemical (MGC) Group benefitted from consistently strong demand for cutting-edge semiconductor-related products. However, demand for general-purpose semiconductors has not fully recovered. Demand also remained weak for basic chemicals and engineering plastics on the back of the prolonged stagnation of the Chinese economy. Moreover, Group operations were partially impacted by the intensification of the Middle Eastern conflict. Thus, the business environment surrounding the Group was generally harsh.
Amid this environment, the MGC Group has pursued its target of “Strengthening the resiliency of our business portfolio” under the medium-term management plan launched in 2024. Specifically, the Group has striven to realize business management focused on optimizing the cost of capital and share prices, to this end pushing ahead with various measures, including “Focusing on Uniqueness & Presence,” “Building new value through innovation,” and “Restructuring businesses requiring intensive management.”
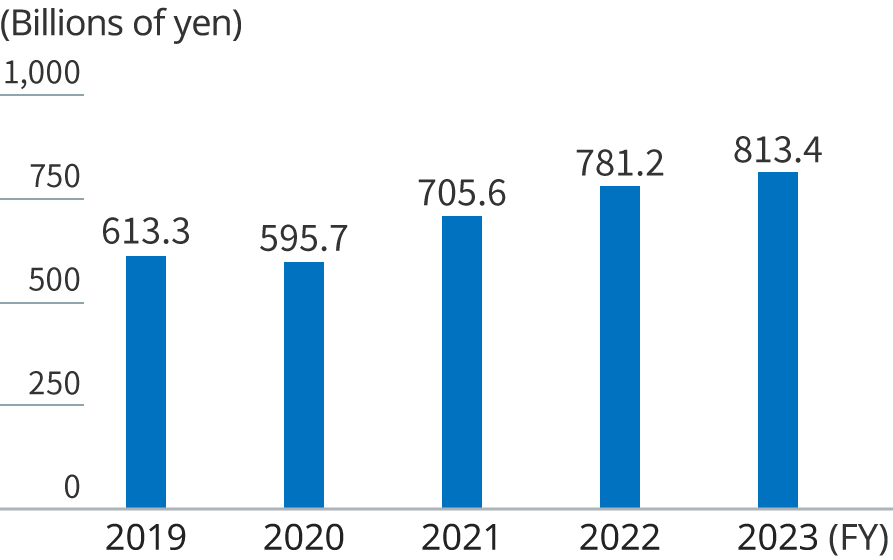
Despite robust sales of electronics materials, the MGC Group’s net sales decreased, mainly due to lower market prices for engineering plastics and methanol, and withdrawal from the ortho-xylene chain business.
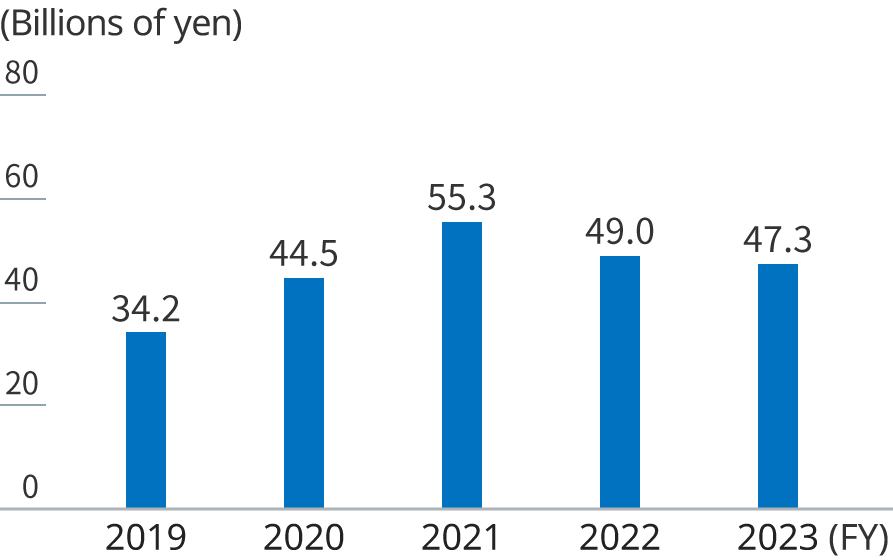
Operating profit declined due primarily to lower market prices for engineering plastics and methanol, intensifying competition in the market for meta-xylenediamine and its derivatives, and growth in fixed costs associated with the expansion of production capacities at a production base for chemicals for use in semiconductor manufacturing in Taiwan.
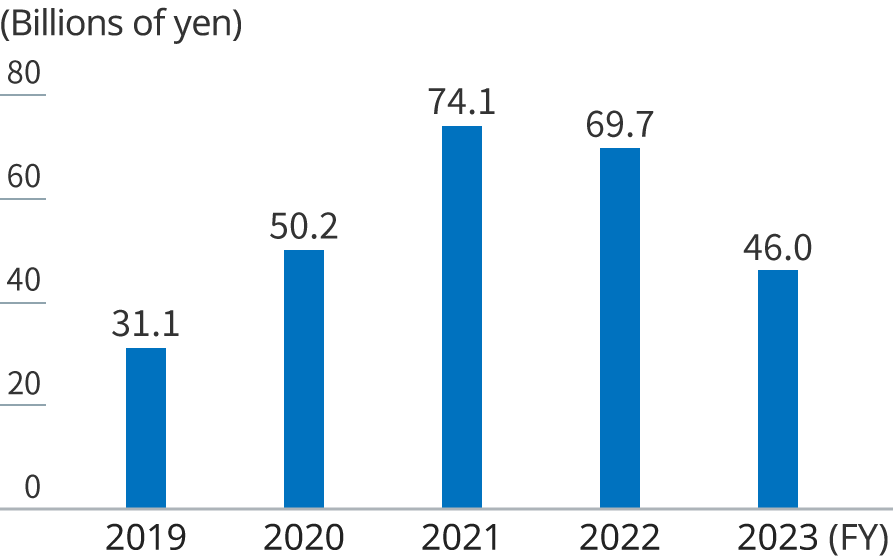
Ordinary profit decreased due mainly to reduced operating profit. Other factors leading to this decrease included lower methanol market prices and a decline in equity in earnings of affiliates resulting from such factors as impairment losses posted by methanol producing companies in the Republic of Trinidad and Tobago.
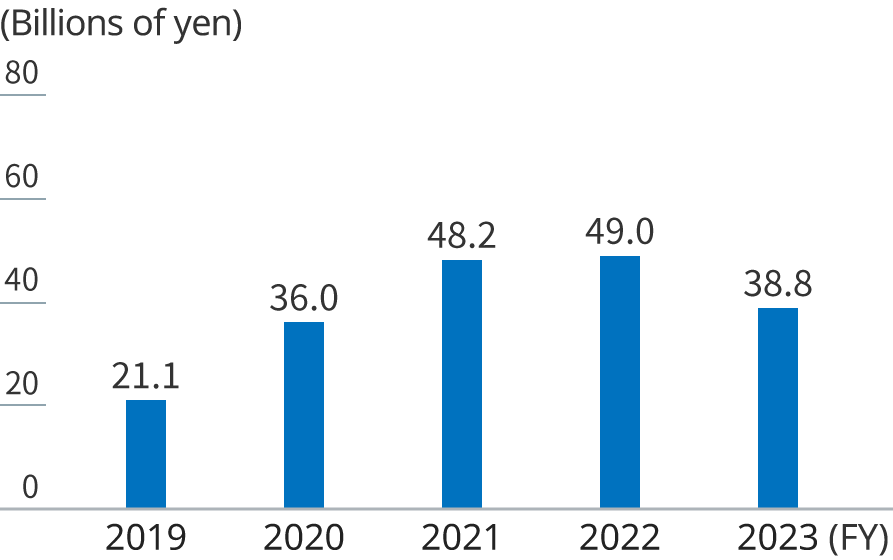
The MGC Group posted a loss attributable to owners of parent due to lower ordinary profit and the impairment of noncurrent assets in connection with several businesses, such as a subsidiary engaged in meta-xylenediamine manufacturing in the Netherlands and a subsidiary engaged in the manufacturing of chemicals for use in semiconductor manufacturing in Taiwan.
Results by Business Segment
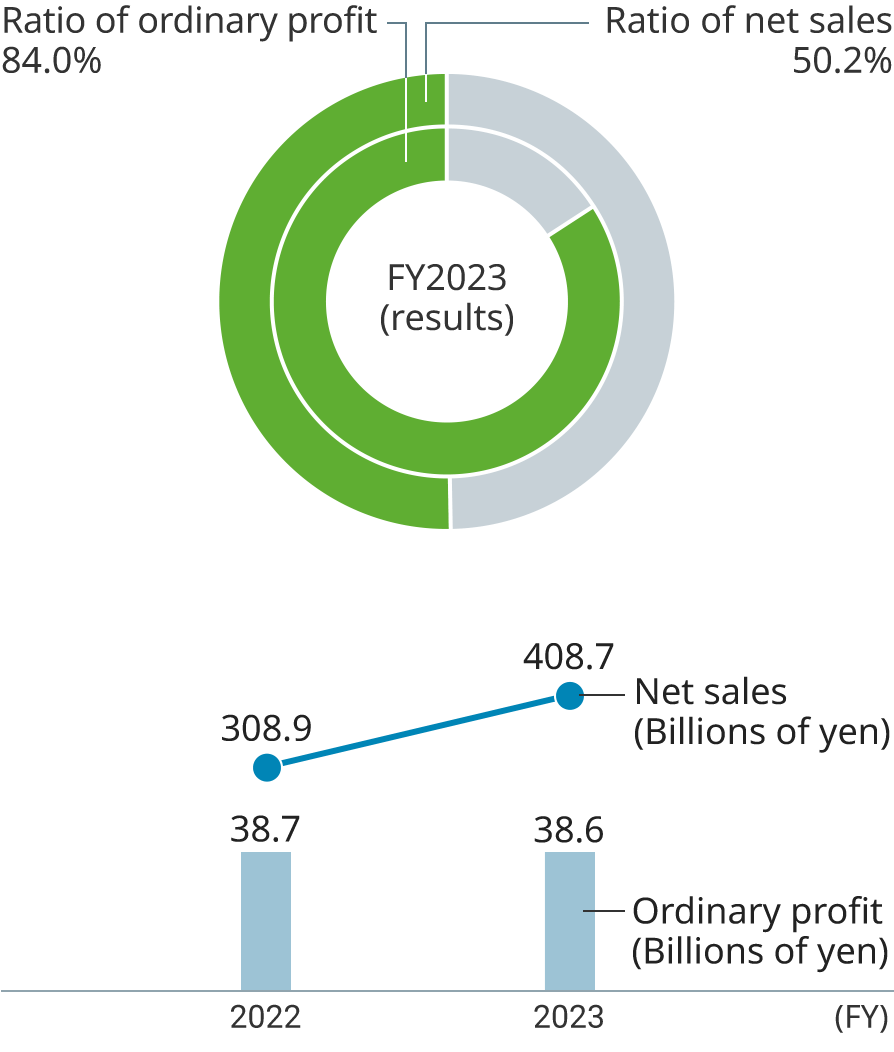
Green Energy & Chemicals
- ※ Pie charts exclude other operations and adjustments.
The methanol business saw decreases in both net sales and earnings due mainly to lower market prices compared with the previous fiscal year. This business was also affected by impairment losses posted by methanol producing companies in the Republic of Trinidad and Tobago.
Methanol and ammonia-based chemicals posted an increase in earnings, despite lower sales prices, thanks to such positive factors as the higher sales volume of MMA-related products and lower fixed costs.
The energy resources and environmental business posted operating profit on par with the previous fiscal year, backed by the robustness of iodine sales, even though net sales declined due to the lower sales volume of LNG for power generation use.
Meta-xylenediamine and its derivatives posted decreases in net sales and earnings, reflecting such factors as intensifying competition and a resulting decline in sales prices, along with higher fixed costs. In addition, these offerings were also affected by the impairment of noncurrent assets at a subsidiary engaged in meta-xylenediamine manufacturing in the Netherlands.
Xylene separators and derivatives posted a decrease in net sales due to the withdrawal from the ortho-xylene chain. However, earnings from these offerings were on par with the previous fiscal year thanks to lower repair costs, with no major periodic repair conducted in FY2025.
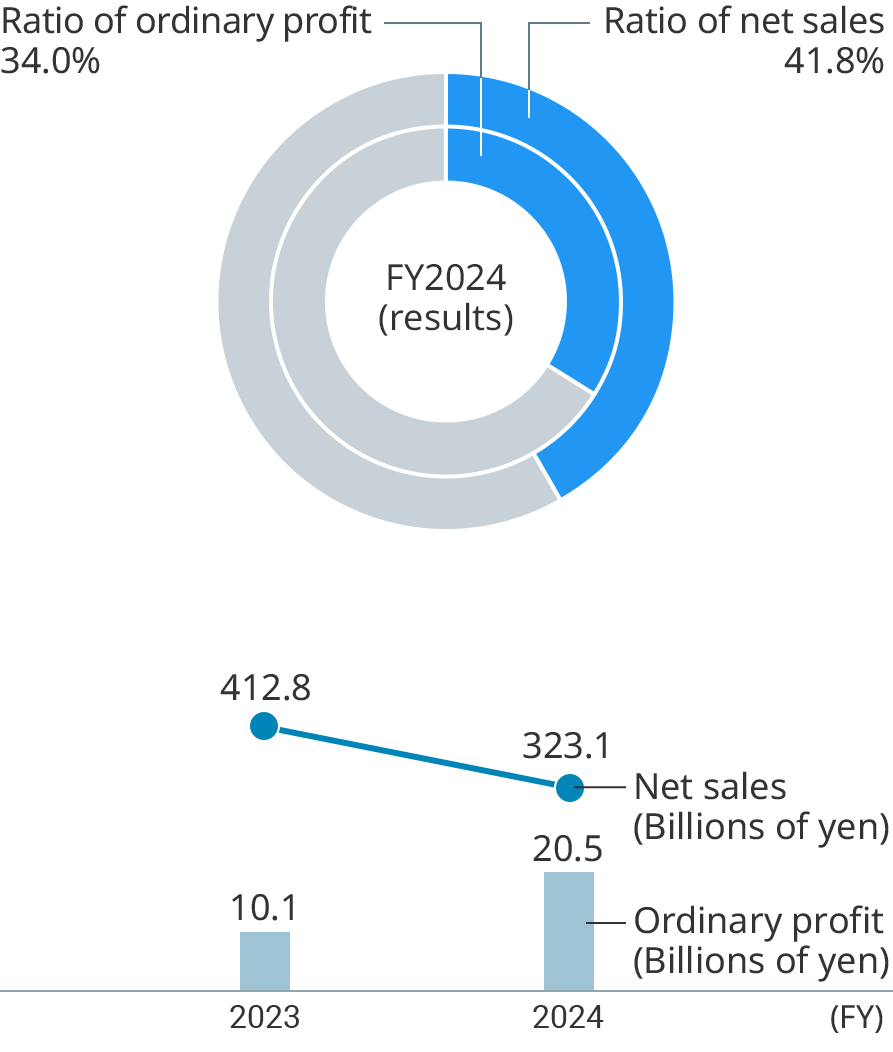
Specialty Chemicals
- ※ Pie charts exclude other operations and adjustments.
Inorganic chemicals posted an increase in net sales due to the higher sales volume of chemicals for use in semiconductor manufacturing. However, earnings from these offerings decreased due mainly to growth in fixed costs associated with the expansion of capacity at a production base in Taiwan. These offerings were also affected by the impairment of noncurrent assets at manufacturing subsidiaries in China and Taiwan.
Engineering plastics saw decreases in net sales and earnings due to deterioration in the profitability of overseas manufacturing bases on the back of lower sales prices for polycarbonate and polyacetal as well as a decrease in their sales volume. These offerings were also affected by the impairment of noncurrent assets related to the polycarbonate business.
Optical materials posted decreases in net sales and earnings. This was due to the lower sales volume of products for use in smartphones, a primary application of optical polymers. Other factors leading to decreases in net sales and earnings included growth in such fixed costs as depreciation.
Electronics materials posted increases in net sales and earnings, even though the strengthening of quality management measures for BT materials for IC plastic packaging resulted in higher costs. The above increases were attributable to growth in demand in a broad range of fields, a customer trend toward securing stockpiles in response to anxiety regarding the supply of some raw materials, and the higher sales volume of OPETM substrate material for AI servers.
LivingTech and hygiene-related products posted a decrease in earnings due mainly to the lower sales volume of oxygen absorbers for export and higher raw material prices.