Pollution Prevention

To prevent pollution and to maintain sound habitats for living things, MGC Group companies monitor the volume of environmentally hazardous substances in wastewater and waste gas and work to reduce discharge volumes.

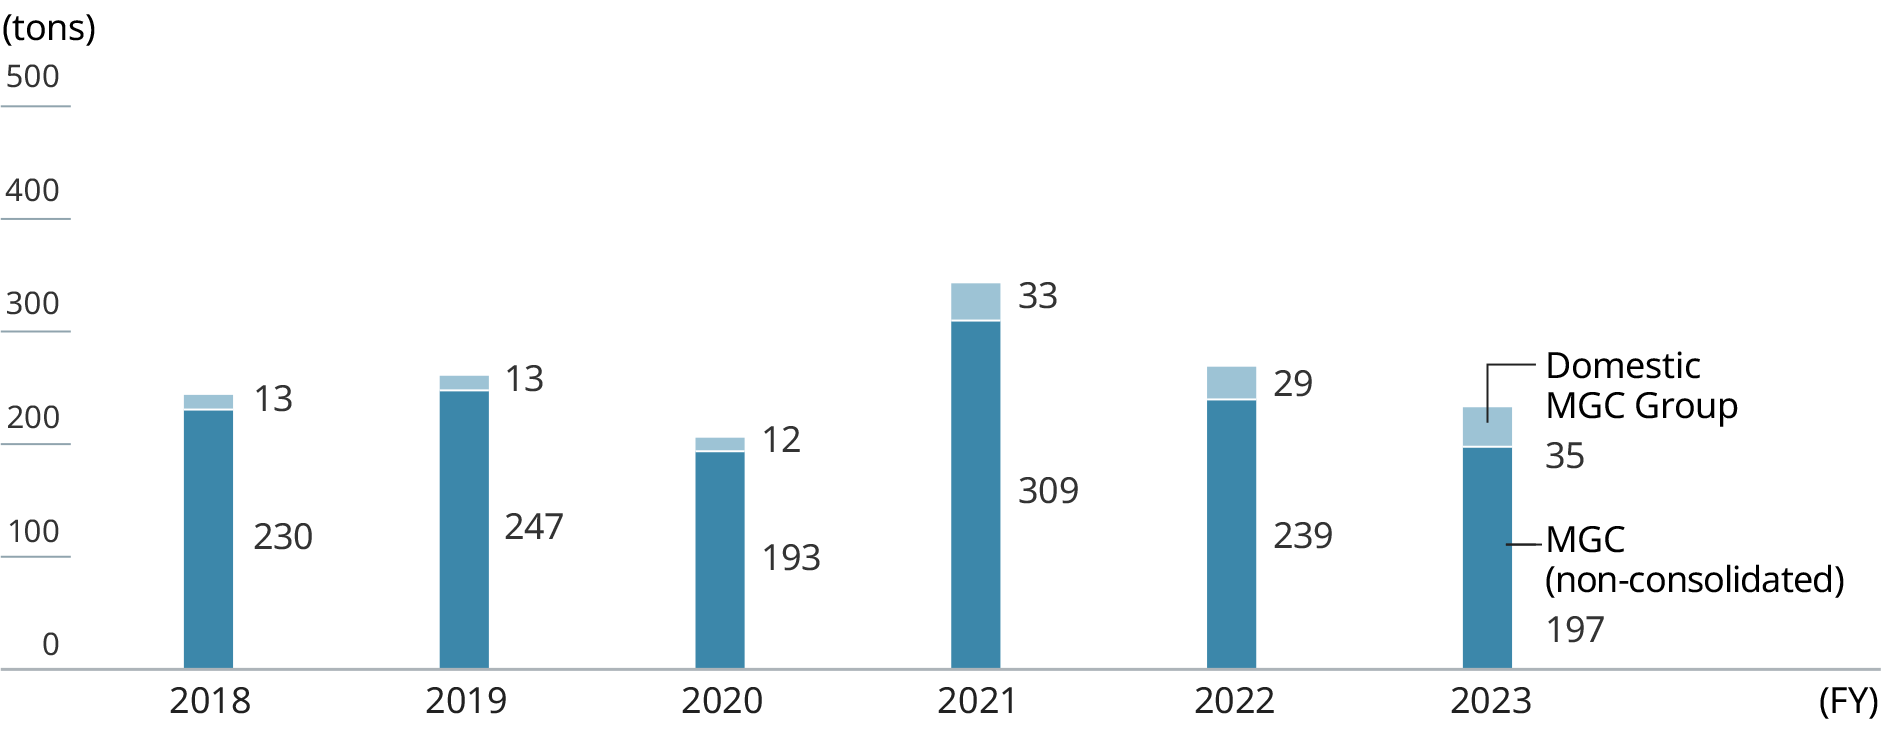
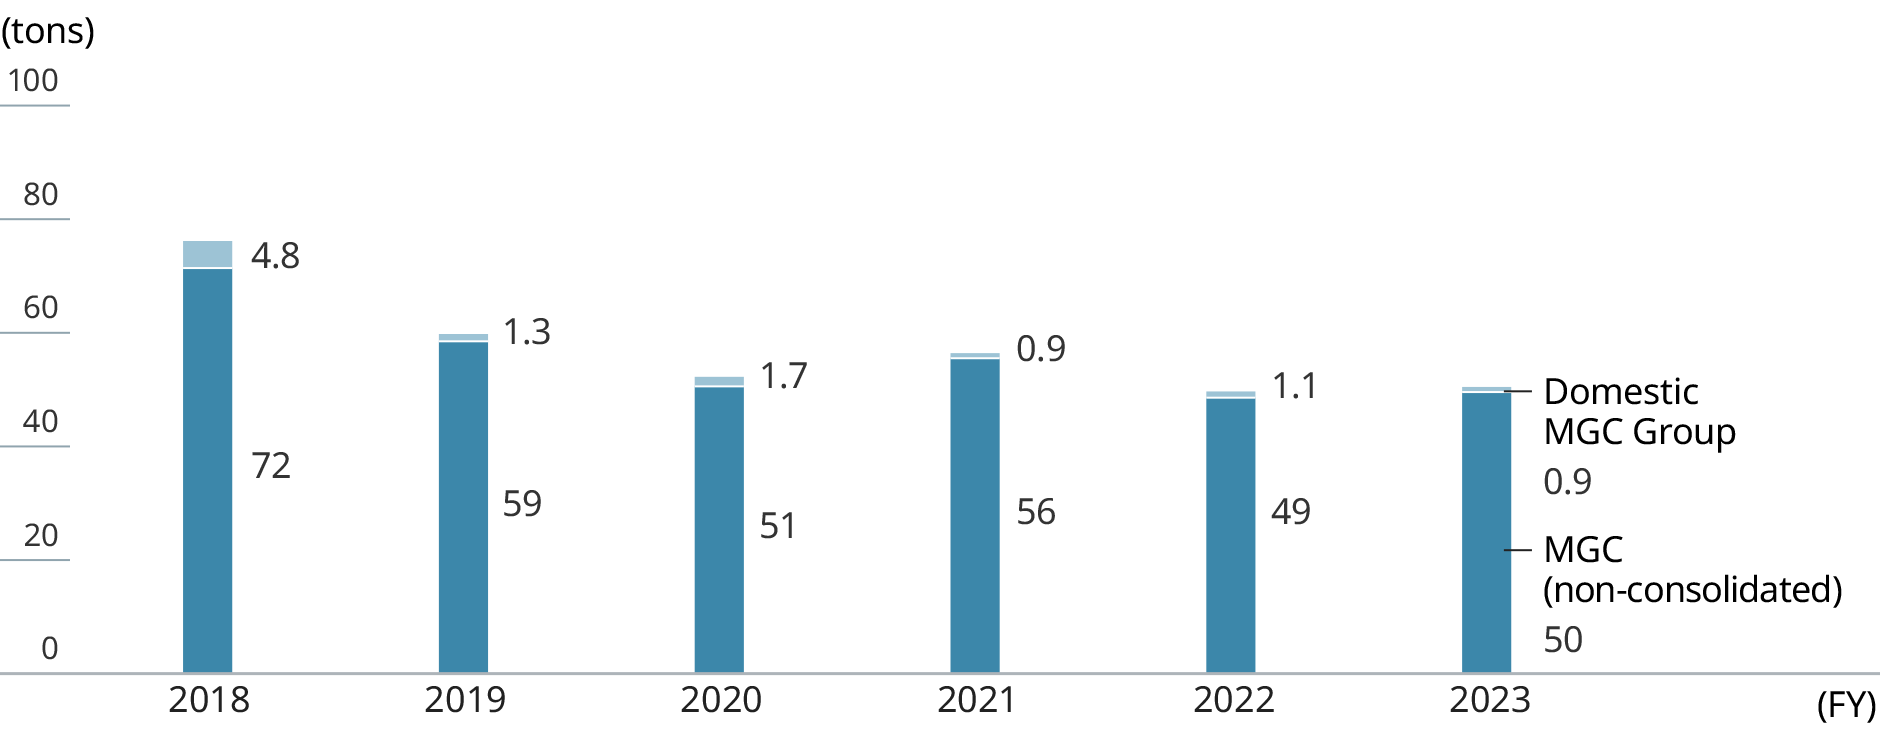
Preserving Air Quality (MGC non-consolidated and domestic MGC Group companies)

Emission of SOx
Graph: Emissions of SOX. Bar charts shows Emission of SOx by Non-consolidated MGC and Domestic MGC Group.
Emission of NOx
Graph: Emissions of NOX. Bar charts shows Emission of NOx by Non-consolidated MGC and Domestic MGC Group.
Emission of soot and dust
Graph: Emissions of soot and dust. Bar charts shows Emission of soot and dust by Non-consolidated MGC and Domestic MGC Group.

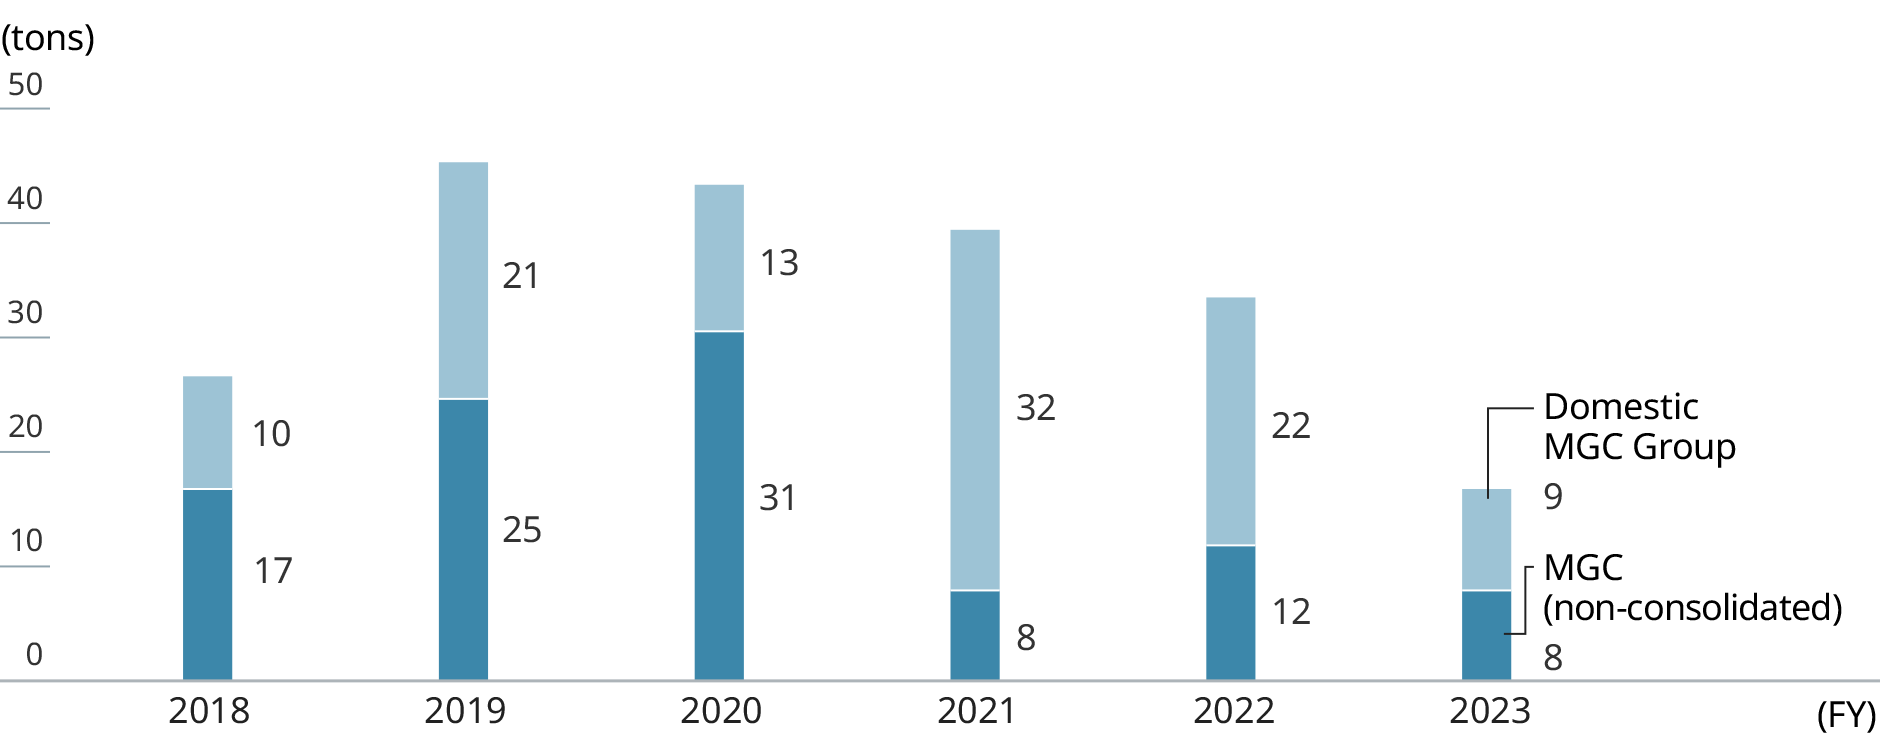
* Past data has been reviewed and corrected.

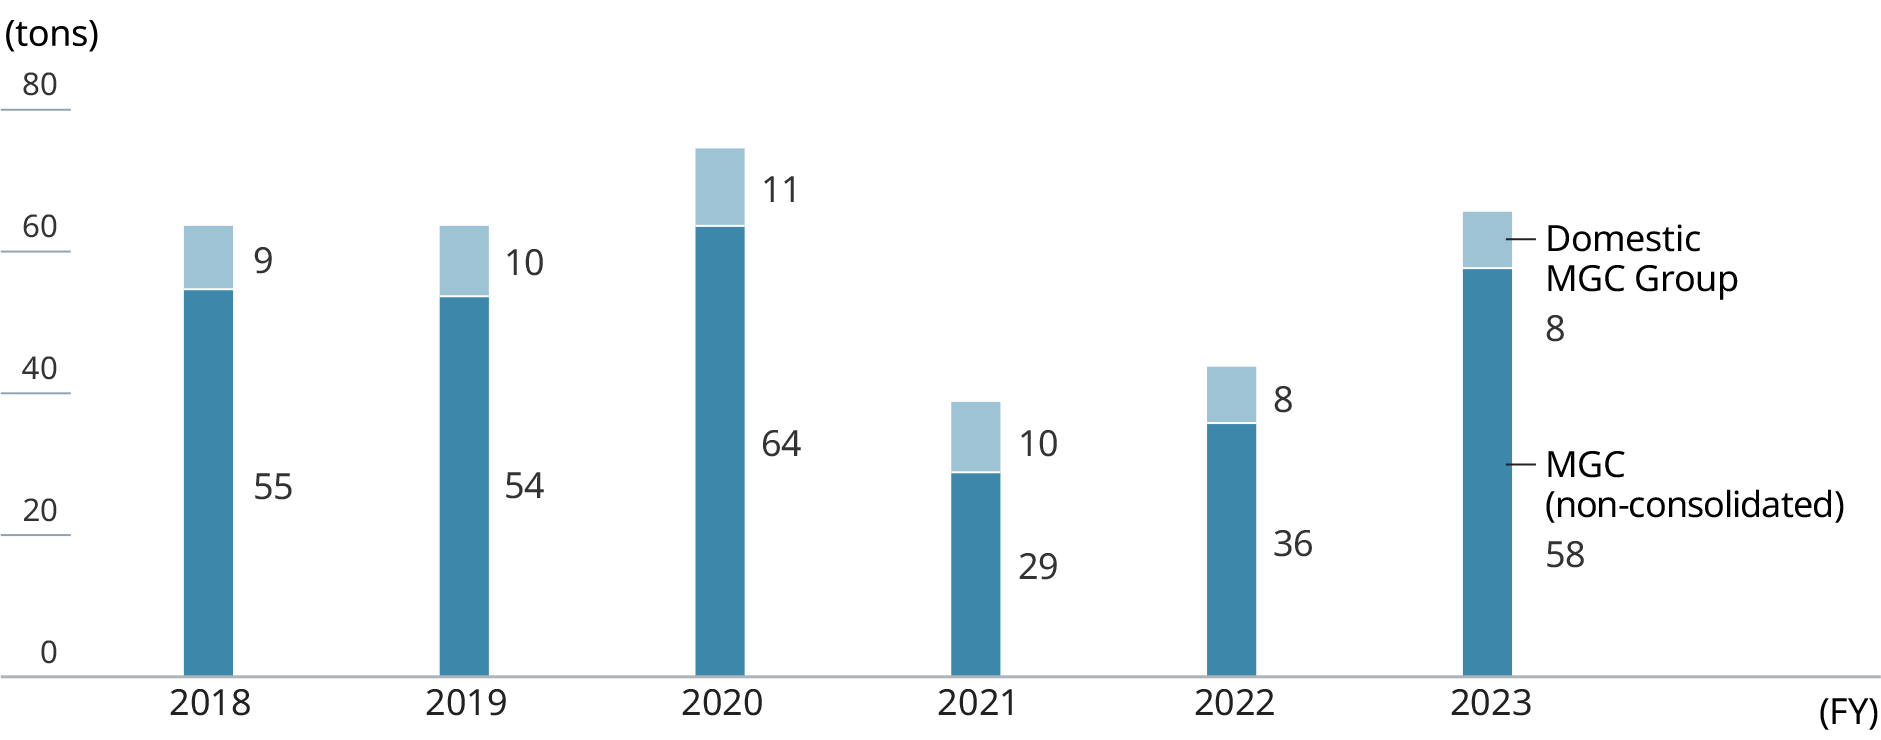
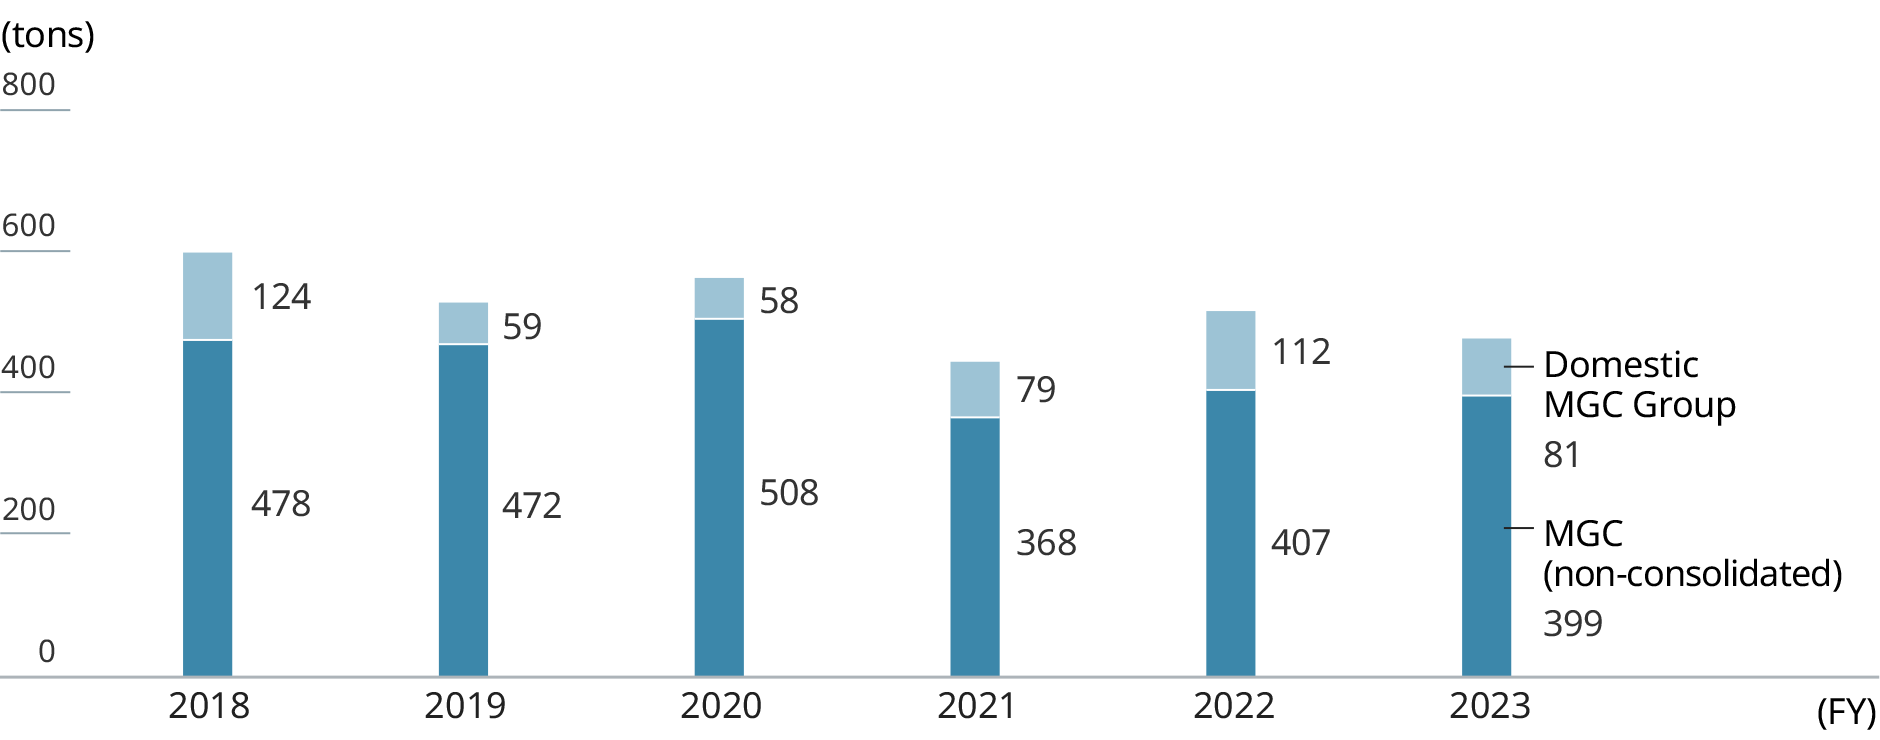
Preserving Water Quality (MGC non-consolidated and domestic MGC Group companies)

Emission of COD
Graph: Emissions of COD. Bar charts shows Emission of COD by Non-consolidated MGC and Domestic MGC Group.

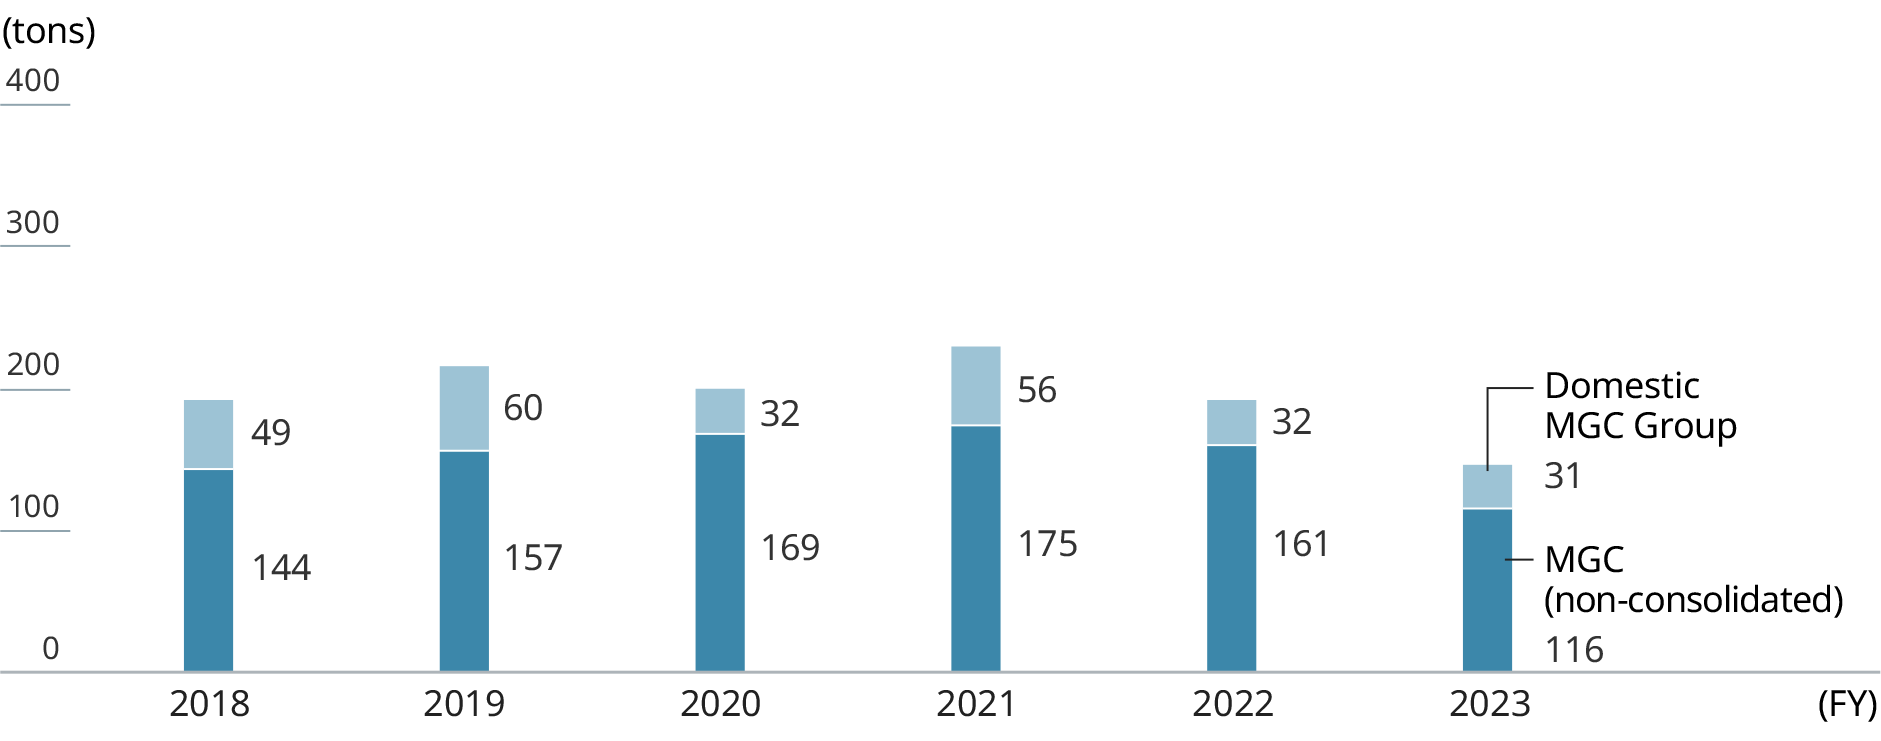
* In cases where only BOD is measured, the measurement data is directly added to COD emissions.

Emission of total nitrogen
Graph: Emissions of total nitrogen. Bar charts shows Emission of total nitrogen by Non-consolidated MGC and Domestic MGC Group.
Emission of total phosphorous
Graph: Emissions of total phosphorous. Bar charts shows Emission of total phosphorous by Non-consolidated MGC and Domestic MGC Group.