Research and Development Organization
Research and Development Sites and Fields

MGC has three research laboratories belonging to the Research & Development Division , and each plant has its own R&D department.
The main purposes of the research laboratories are to enhance competitive businesses, develop new products based on existing products and technologies, and conduct R&D aimed at creating new core businesses in areas with medium- and long-term promise. The R&D departments at each plant deal with improvements in production technologies and applied product research.
Research & Development Division
In addition to promoting companywide R&D, the R&D Administration Department also promotes digital transformation relating to R&D activities.
The Future Strategy Department selects the business areas that MGC should follow, proposes commercialization concepts, and supervises search activities for MGC as a whole. The New Business Development Department oversees the promotion of new products right up to commercialization. The Administrative Department handles the back-office functions of research activities in general.
Intellectual Infrastructure Center
The Intellectual Property Department formulates strategies relating to intellectual property and their promotion. The Technical Intelligence Department promotes the intellectual property landscape and handles the summarization of technical surveys. The Chemical Analysis Department establishes new methods of analysis and evaluation and implements highly reliable analysis.
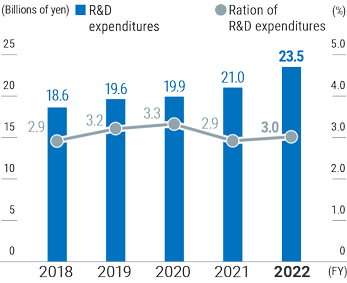
Research and Development Data
In order for MGC to continue to develop as a highly differentiated, widely recognized chemicals group operating from a strong platform of proprietary technology, we make a strong effort in research and development. The number of employees engaged in R&D activities total 1,050 (consolidated, approximately 10% of all employees), and in 2022, the R&D costs account for around 3% of sales.
| Year | 2013 | 2014 | 2015 | 2016 | 2017 | 2018 | 2019 | 2020 | 2021 | 2022 |
|---|---|---|---|---|---|---|---|---|---|---|
| Sales | 5,344 | 5,295 | 5,935 | 5,564 | 6,359 | 6,489 | 6,133 | 5,957 | 7,056 | 7,812 |
| R&D expenditures | 161 | 168 | 189 | 192 | 189 | 186 | 196 | 199 | 210 | 235 |
| Rate of R&D expenditures in sales (%) |
3.0 | 3.2 | 3.2 | 3.5 | 3.0 | 2.9 | 3.2 | 3.3 | 2.9 | 3.0 |